Yesterday we started to see a shift in the weather models in terms of Hurricane Florence. Currently most weather models have Florence moving extremely slow along the North Carolina coast and then moving southwest and hitting closer to the North/South Carolina boarder.

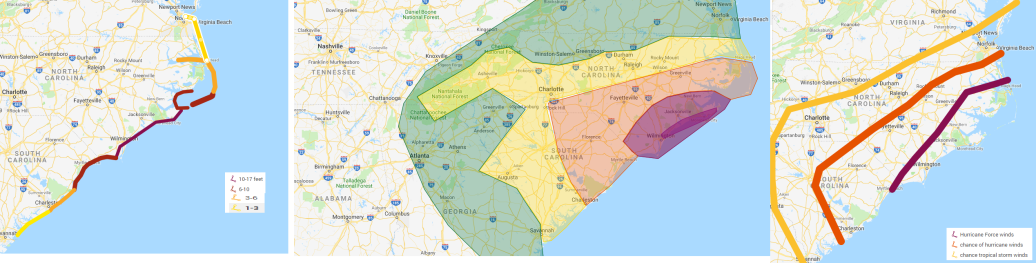
Storm surge forecast. map on the left.
From Baldhead Island north to Harker’s Island storm surge of 10 feet or more is likely. The area north of the eye will likely have the highest storm surges. There will be waves on top of the storm surge that will increase water levels even more. Storm surges decrease as you go south of Baldhead island and north of Harkers island up to the Virginia/north Carolina boarder. This will create massive amounts of damage from the outer banks down to around Georgetown South Carolina area.
Rainfall. 12 to 36 inches of rain is likely in the purple shaded area, with some areas seeing 36+ especially the locations in the darker purple area. Remember just like the powerful nor-easters, the rain will be in the form of bands, some areas might get less or more in the range.
Orange is 6 to 12 inches of rain which will still cause massive flooding.
yellow is 3-6 inches and green is 1-3 inches. These amounts will also create massive flooding issues as the ground is already saturated.
Most in eastern North Carolina and most in South Carolina will see flooding rivers and many will see coastal issues.
Map on the right shows the areas most likely to get hurricane force winds and tropical storm force winds. Areas along and east of the purple line will likely have Hurricane Force winds (IE steady winds or consistent gusts over 74MPH.) Areas east of the Red Line will have tropical storm force winds with a chance of Hurricane force winds. Areas east of the yellow line will have a chance of tropical storm force winds.
All of these maps could change based on exact track of Hurricane Florence.
